Monday 17 December 2012

Bring your pictures to life


A picture can speak a thousand words.  Pictures can bring a document or presentation to life.  So you wouldn't want them to be dull and lifeless would you?

These days we use all sorts of devices to take photos, not just cameras.  It's great that we can take pictures with phones and tablets, but the quality isn't always that great.  Even snapshots taken on our cameras can sometimes look a bit flat, especially when the British weather fails to provide us with perfect lighting!  In the past we had to use specialist software like Photoshop to correct pictures. Here I'm going to look at a few techniques available in Office 2010 to adjust your photos and bring them to life.

In these examples I am using Word, but these options are also available in PowerPoint.  When you click on a picture in Word or PowerPoint you will see a new tab appear on the Ribbon called Picture Tools Format and the adjustment options shown here are can be found on that tab.


Here's a picture of a duck.


Cute isn't it?
This is the picture as it was taken. 

First of all, we probably don't want those feet in there so we can crop the picture so that we just see the duck. 

Cropping cuts away the edges of the picture - the bits we don't want.  It is useful where we have things in the picture (such as my husband's feet) that we don't want.  Even if the feet weren't there, the image becomes much more engaging when the subject matter (the duck) fills the picture so getting rid of any extra bits is always a good idea.  You should also think about cropping if you have a picture that doesn't quite fit the space you have for it.  Rather than squashing or stretching the image to fit, look at removing any bits that are not necessary.


Don't be scared of cropping - the bits you have cut away are still there in the memory so if you decide you want to put them back in later you can.


Next, the sun had disappeared and the picture is a bit dull and grey.  We can adjust the colour tone and saturation to make the picture seem warmer and richer.  You will find these behind the Color button.
Here I have adjusted the colour tone to it's warmest but I have left the saturation as is.


Finally, while the camera's focus is quite good, the duck wasn't co-operating by standing still so it could be better.  (Seconds after the photo was taken the duck tried to eat the camera and succeeded in taking a lump out of my husband's finger!) 

Using the Corrections button, I have taken both the sharpness and contrast up a level.  Now you can see much more definition of the bird's feathers, making the picture much more life-like.


What else can you do with images?


You can remove the background - this can look particularly effective on PowerPoint slides.  

In Word you can then set text wrapping to 'Tight' so that your text lines up to the shape of the image.  As with cropping, the background is still in memory so you can choose to put it back if you wish.  It works best if there is quite a good degree of contrast between the subject and the background.  You may need to play around with it a bit to get all of the subject included.


Or you could apply Artistic Effects - for example turning our duck picture into a pencil sketch…


You could also try some of the Picture Styles to add a border, frame, shadow or reflection.  These can make the picture stand out from the page more.

Finally, when you are happy with your pictures you will want to save your document or slide show.  Remember that photographs taken with modern digital cameras can be several MB in size.  If you have a number of pictures in your document then your file is going to be huge. Not only will this take up valuable space on your computer or network, but it also means that your document or slide show will be slow to open and to navigate. 


Word and PowerPoint both have a setting to compress pictures.  This reduces the file size in two ways.  First of all, you are given the option to remove cropped areas - remember I said that the bits you cropped away were still there?  They are taking up space so if you are sure you don't want them, get rid of them. 

Secondly it reduces the resolution of the picture.  The level you want to reduce it to will depend on how your document or slide show will be viewed.  If the document is going to be professionally printed you will want to keep a fairly high resolution.  If it is to be viewed on screen then a medium resolution is good.  If it is to be published on the web or if you need to email it to other people then you will want to minimise the resolution and thus minimise the file size.

There are so many picture editing options it would be impossible to show them all.  
Remember, if you need some help working with images in your documents or with bringing your PowerPoint slides to life, call NIMBUS solutions on 07733 341452 or visit www.nimbus-solutions.co.uk to find out more about how we can help.


Wednesday 31 October 2012

Find your emails the easy way.

Search tips for Outlook 2010

Have you ever struggled to find an important email? Perhaps a client phones you and says “…about that email I sent you last week…” and you are left scrolling through last week’s emails trying to find it, or wondering which folder you might have filed it in. Whether you keep all your emails in your inbox or you file them in folders, there are always times when you struggle to find an item and these tips should help you.


Instant search


Above the Inbox pane is the instant search box. Type your search term in the box – it might be the name of the sender, or the subject or just a keyword or phrase that you might expect to find in the email you are looking for. This will filter your inbox (or whichever folder you have open) to show just the emails that meet your criteria, making the one you want easier to find.


Search contextual tab


When you click in the Instant Search box you will see a new tab open on the Ribbon – the Search tab. Here you can carry out a more refined search if your instant search returned too many results, or didn’t return the item you were looking for. You can also get Outlook to search all of your sub-folders at the same time, just in case you filed something in the wrong place.

The Search tab allows you to search all items, not just mail items. You wouldn’t believe the hours I’ve spent searching for a document that I know someone emailed to me, only to find it attached to a meeting request!


Search Folders

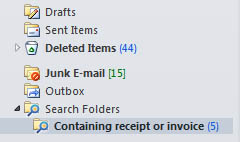
Search folders will give you a list of emails that meet certain criteria wherever they are stored, but doesn’t actually move the email. For example, you could set up a search folder that returns all of the emails from a particular client or colleague, even if those emails have be stored in different folders according to the particular project they refer to.

In this example I have created a search folder looking for the words ‘Invoice’ or ‘Receipt’. This means that you could file any such emails against the relevant project, customer or supplier yet when you come to do your bookkeeping you can view all of them in one place.


So now there's no excuse for losing emails!


Find out more or contact me for more help with Outlook

Friday 5 October 2012

Office 2013 - My review


Just as you were getting used to Office 2010 - along comes Office 2013!
So, what is new?  Is it worth getting or is it just a ploy to get you to part with your money?
I have been using the trial version so that I can familiarise myself with the software before it is officially released and just try it out and see how I get on with it.  If you want to try it too, visit the Microsoft website though you might want to read this blog post first.

What is new?
In terms of features, not a lot.  There are some nice enhancements of existing features but nothing that made me wonder how I'd ever lived without it.  The tools that you use are all in the same places as before so no big changes.

The look has been updated with what Microsoft describe as a cleaner, fresher feel.  Below is the Excel interface for the 2010 and 2013 versions.  You can see that 2013 is much plainer and flatter.  The ribbon is now white rather than light grey, the icons are more stylised and the tab headers are in capitals rather than lower case.  


Personally I'm not keen.  If you are someone that works with a computer all day long, the completely white interface is a bit too bright and the capitalised tab headings are a bit too 'shouty'.  The flat design makes it harder to distinguish between the different areas of the screen, especially in Outlook where there are several panels showing different information.  But that's just my opinion - decide for yourself. 


You may notice on the 2013 interface, in the title bar area there are some (very faint) clouds.  When you first set up Office 2013 you can choose a design to personalise your interface.  I think it is meant to make it feel a little less clinical but I'm not sure that it works.

It's not all about looks though.  The key difference between Office 2013 and previous versions is that 2013 is designed to work with Office 365, Microsoft's cloud-based service.  When you register the software you have to set up an Office 365 account and by default it will try to save your files there.

There are many advantages and disadvantages of working in the cloud, perhaps a debate for a future blog post.  The obvious advantage being that you can share files and even work together on the same files, with colleagues and clients in other locations.  For smaller businesses this does offer a secure way to enable more home working   But of course this only works if there is a reliable internet connection.

There are one or two new features.

When you open any of the Office applications, rather than getting a blank document / workbook etc. you are taken to a landing screen where you can choose from your recent files, browse to find a file or create a new one either from a blank file or from a template.

Excel has a new Quick Analysis feature.  When you highlight some data (as in the example below) you will see a small icon appear at the bottom of the selection. Hover over this icon to see a selection of commonly-used analysis tools.  Hovering over any of the options (the example below shows the conditional formatting options) will show you a live preview of that option.

Excel also has a new feature called Flash Fill.  When working with a table of data, if Excel detects a pattern in the column you are entering, it will automatically fill to the end of the column and you can choose to accept or reject the input.  So for example if you have a column of first names and a column of second names and you want to add a third column of full names (combining first and second names), type in the first couple of names and Excel will fill in the rest. 

I tried this out. It doesn't work perfectly. The first surname on my list began with Mc - all of the suggested names were then given the Mc prefix. After correcting the first suggestion most of them were then corrected. However one or two remained with the Mc prefix. I only had about 20 names on my list so it was easy to check and make corrections - using this with a longer list could cause problems.

Word has some enhanced layout features.  If you are familiar with wrapping text around images, you'll know how frustrating it could be to get the image in just the right place to make the text flow nicely around it.  Now there is live text wrapping which moves the text as you drag the image so that you can get it in the right place first time.  You can also embed videos into your Word documents.

In the 2007 & 2010 versions we were finally given the opportunity to save documents in PDF format.  In 2013 we also get the opportunity to open PDF files in Word and then edit them. 

Microsoft want people to start using their cloud offering - Office 365 - and that is the main purpose of Office 2013.  The new look seems to have been designed by people that don't have to use the software on a day-in-day-out basis and there are just a few enhanced features in there so that users might feel as though they are getting something new.  My view is that unless you are serious about moving your systems into the cloud, Office 2013 is more like the Emperor's new clothes.

Don't take my word for it!  Try Office 2013 for yourself.  You can download it to run alongside your existing version of Office, so if you really don't like it, it's easy to switch back.  It's very easy to do.  Full instructions are on the website.  Give it a go!


Monday 17 September 2012

Make your data talk to you


Conditional Formatting

One question I get asked a lot is how can I get Excel to flag up when I've spent too much / my stock is low / I've reached my targets, etc. The answer is conditional formatting.


Conditional formatting does exactly what it says. It applies formatting to the cells in your spreadsheet when certain conditions are met. In Excel 2003 and earlier versions, the conditional formatting was quite basic and difficult to use, but from 2007 onwards it is easier to use with much improved functionality.

There are lots of ways to use it.

  • Apply it to your monthly budget sheets to flag up when expenditure exceeds a certain limit.
  • Use it to identify overdue invoices
  • Find the highest or lowest values in a range of cells
  • Use it to highlight duplicate records
  • Use traffic lights or other symbols to track performance against targets

So how does it work?

On the Home tab, about halfway along, you will see the Conditional Formatting button. Click on it to see a drop-down menu of conditional formatting functionality.


The first option is Highlight Cell Rules.  Use this to highlight any cell that meets your criteria.  This could be a value greater than, equal to, lower than or between whatever values you set.  It could also be a text string, a date before or after your defined date or a duplicate value.  You then choose what format to apply.  There are a few built-in formats (e.g. light red fill, dark red text) or you can define your own.

The second option is the Top/Bottom Rules.  Here you will be presented with six options: Top 10, Top 10%, Bottom 10, Bottom 10%, Above average and Below average.  Don't be put off if you want, for example, the top 3 items or the bottom 25% - you have the opportunity to change this once you have chosen the appropriate option.

Next is Data Bars.  This is particularly useful if you have a column of data as it creates the appearance of a bar chart in your cells.  This can give a table of numbers much more visual impact, making it clear at a glance how the numbers relate to each other.


The next one is Color Scales.  Here you can choose the colour to represent the values at either end of your range, and Excel will apply colours to each cell that fade through from one end to the other, so that you can see where any item is on the scale.

When the data is jumbled up this can look a bit messy as you can see on the left, but when it is sorted into order it becomes much clearer as on the right.

Finally we get to Icon Sets.  This allows you to apply icons such as flags, ticks and traffic lights to the data based on the values so you can see if your targets are being met.  

Initially Excel will split the data equally between the icons, but you can change the criteria. However, your targets might be based on particular values rather than an equal split. The Manage Rules option at the bottom of the Conditional Formatting menu will allow you set your own criteria.


Conditional Formatting is fun to play with and can make your data much easier to interpret if you use it carefully.
Go on and have a go!
And don't forget if you want help with Conditional Formatting or with any aspects of using Microsoft Office, book a training session with NIMBUS solutions.  


Thursday 23 August 2012

Get Word to do your sums


Did you know… you can use formulas in Word tables?

Lots of people say to me "wouldn't it be useful if you could get Word to add up values in tables?"
They are quite surprised to learn that Word can do exactly that!

Now obviously Word isn't going to replace Excel for doing calculations.  It's not what Word is designed for, whereas it is exactly what Excel is designed for.  If you have a lot of data to work with, or if you have complex calculations then Excel is still the best place to do that.

But sometimes you just want to add up a few numbers in a table and, to save you reaching for the calculator, here's how.

First you need to set up a table with some numbers in.  


With the cursor in the empty cell where you want the formula result to appear, go to the Table Tools Layout tab and click the Formula button in the Data grouping.


This will bring up a dialog box with a suggested formula.  In this example the formula says SUM(ABOVE) and this will add all of the numbers above the cell where your formula is, in the same column. 


This is the formula we want to use so click OK.
The result is then shown in the table.


This feature works really well in templates for invoices or standard reports.  In the table below I have created a simple invoice table.  All of the numbers in the Total column are calculated using Word formulas, which I have shown on the right.  I also used the Number format drop-down in the formula dialog box to select a currency format.


Word isn't as clever as Excel and it doesn't automatically update formulas when the numbers change.
To update your formula result to reflect any changes, select the cell with the formula in it (or select the entire table if you have used several formulas) and press F9.

There are other formulas you can use and there are other ways of referencing the cells to include in the formula.

This is a topic that I would typically cover on an Advanced Word course, or on any of my tailored training sessions if you so choose.
Alternatively, if you think this is a bit too complicated then send your documents to me and I can add the formulas in for you. 


Joanne Hansell

www.nimbus-solutions.co.uk

Customised, affordable IT Training.  
For your business.  For you.